| dc.contributor.author | Nzioka, John Muthama | |
| dc.contributor.author | Njeri, Joseph Karianjahi | |
| dc.contributor.author | Karanja, Fredrick K. | |
| dc.contributor.author | Manene, Moses M. | |
| dc.date.accessioned | 2014-08-01T13:38:05Z | |
| dc.date.available | 2014-08-01T13:38:05Z | |
| dc.date.issued | 2014 | |
| dc.identifier.citation | Nzioka, J. M., Njeri, Joseph Karianjahi., Karanja, Fredrick K., Manene, Moses M (2014). On the Relationship between Satellite-based Evapotranspiration and Normalized Difference Vegetation Index, Case Study: Narok County of Kenya. Africa Journal of Physical Sciences, 1(1). | en_US |
| dc.identifier.uri | http://www.uonbi.ac.ke/journals/index.php/ajps/article/view/1223/1040 | |
| dc.identifier.uri | http://hdl.handle.net/11295/73524 | |
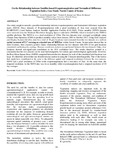
| dc.description.abstract | This study sought to unearth a possible relationship between evapotranspiration and Normalized Difference vegetation
index (NDVI). Daily datasets of Evapotranspiration with a pixel resolution of 3km were sourced from the
EUMETSAT’s Land Surface Analysis Satellite Application Facility (LSA-SAF). Twice monthly (NDVI) datasets
were retrieved from the Moderate Resolution Imaging Spectro-radiometer (MODIS) which is housed by the TERRA
satellite platform. The NDVI is at a pixel resolution of 250m. The two datasets were averaged accordingly using
Climate Data Operators (CDO) to produce monthly values from January 2001 to October 2012. Using Grid Analysis
and Display System (GrADs), data for a total of 36 grid locations were extracted from the two datasets at a uniform
spatial increment of 0.1˚ covering an estimated area of 3600Km2 within Narok County. Scatter plots showed that in
most locations, there existed a positive linear relationship between the two datasets with 80% of the grid locations
considered confirming this analogy. Pearson correlation analysis was performed between the two datasets. Only a few
locations showed non-significant correlations at the 95% confidence level. The results therefore pointed to a
conclusion that the two datasets can be used interchangeably for various agro-meteorological applications. However,
the Root Mean Square Error (RMSE) computed between the two datasets for each of the considered grid locations was
large. It’s therefore advised that one should exercise caution in using the 2 datasets interchangeably. One of the factors
that might have contributed to the error is the different spatial and temporal resolutions between the two datasets.
NDVI had a pixel resolution of 250m while evapotranspiration had a resolution of 3km. At the same time, the
temporal resolution for the NDVI data was twice monthly while evapotranspiration had a temporal resolution of 10
day averages. | en_US |
| dc.language.iso | en | en_US |
| dc.publisher | University of Nairobi | en_US |
| dc.subject | Grads, CDO, Pearson product moment correlation, Scatter plots NDVI, Evapotranpiration | en_US |
| dc.title | On the Relationship between Satellite-based Evapotranspiration and Normalized Difference Vegetation Index, Case Study: Narok County of Kenya | en_US |
| dc.type | Article | en_US |
| dc.type.material | en_US | en_US |